
June 4, 2026

I Asked a Room Full of Leaders to Predict the Future, With Dice
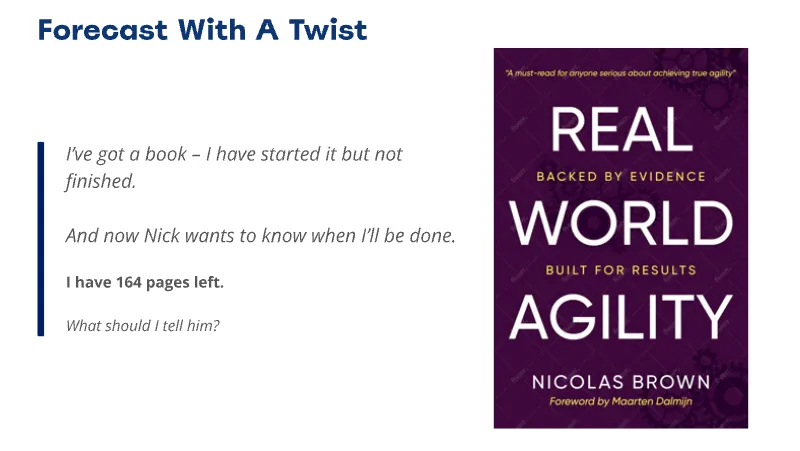
Not About the Book — About How We Predict the Future. The Opening Slide From The Deck
“How long will it take me to finish my colleague's book?”
That’s the question I asked a room full of senior leaders, people used to roadmaps, deadlines, and PowerPoint decks that turn ambiguity into bullet points. I gave them some context. I showed them real data. Then I handed them dice.
The goal? Not a gimmick. Not a game. A lesson.
I wanted them to feel the difference between guessing and modelling. To experience, in their gut, the shift from certainty to probability. Because here’s the truth: when we forecast, we’re not trying to see the future. We’re trying to reflect the shape of what might happen.
This blog post is about that exercise, and the surprising way a simple book (brilliant though it is), a few dice, and some historical data broke open a new way of thinking, not just about delivery dates but also about leadership, trust, and the kind of decisions that thrive in uncertainty.
Spoiler: Monte Carlo isn’t magic. It’s just math. Simple math. The kind you can roll with.
The Illusion of Certainty
We’ve been trained to ask for a date. One number. A finish line to build plans around.
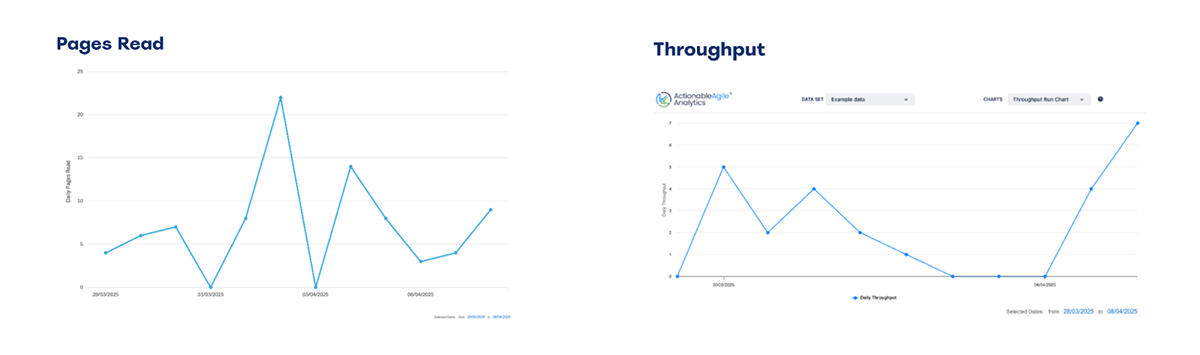
But the moment I asked the room, “How long will it take to finish the book?”, things got uncomfortable. I showed them the historical data, my actual pages read per day log, and I asked them to make a forecast.
The responses varied wildly:
- “I’d divide by my average.”
- “I’ve read books like this before; they usually take 10 days.”
- “It depends on how good the book is!”
- “I’d just set a daily goal, 20 pages a night.”
Each approach made sense in isolation. Each reflected a different mental model. But all of them, even the “correct” ones, were reaching for a single answer.
That’s the illusion.
We fall for it in delivery meetings, roadmap reviews, and quarterly planning. We act like we can see around corners, like the future is just a spreadsheet we haven’t opened yet. But what we really have is history, and history is messy. It has good days, bad days, and everything in between.
We’ve confused prediction with performance. And we’ve built a culture that punishes uncertainty, even when it’s the only honest answer.
The Book and the Dice
Let’s rewind to the setup.
Here’s what I actually gave each pair:
- 1 twelve-sided (fair) die
- A chart mapping each side of the die to how many pages I’d read on a real day. Actual historical data, from days when I read 22 pages, and others when I read none at all.
- A block of Post-its and a Sharpie.
- An instruction card detailing the “method”.
That’s it — nothing more.
The instructions were simple:
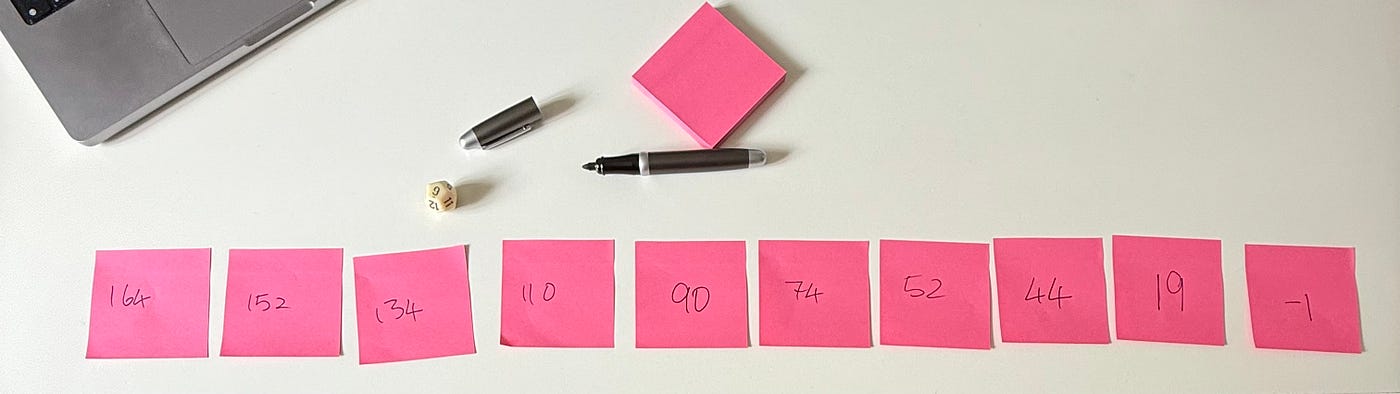
- Start with 164 pages left.
- Roll the die.
- Look up the number of pages read that day.
- Subtract it from the number you had previously.
- Write down the new total on a new Post-it.
- Repeat until you hit zero or less, and count the number of Post-its you have in your chain; that’s your finish day.
One sticky note per roll. One roll per day.
It was slow. It was tactile. And it was transformational.
Each pair in the room generated a different finish date. Then they did it again. And again. The results varied. Some timelines were short, some were long. Some finished in 9 days, others in 20.
That was the point.
They weren’t making point estimates anymore. They were generating a distribution.
They were no longer guessing — they were simulating.
The dice weren’t the magic. They were the bridge from intuition to insight.
Monte Carlo Is Not Magic
At some point during the simulation (I have done this exercise a few times at this stage), someone always asks:
“Wait… this is it? This is Monte Carlo?”
Yep. That’s it.
No fancy tooling. No machine learning. No advanced math. Just rolling the dice, again and again, using real data to reveal the shape of many possible futures.
In doing so, it reveals the future as it really is: uncertain but not unknowable.
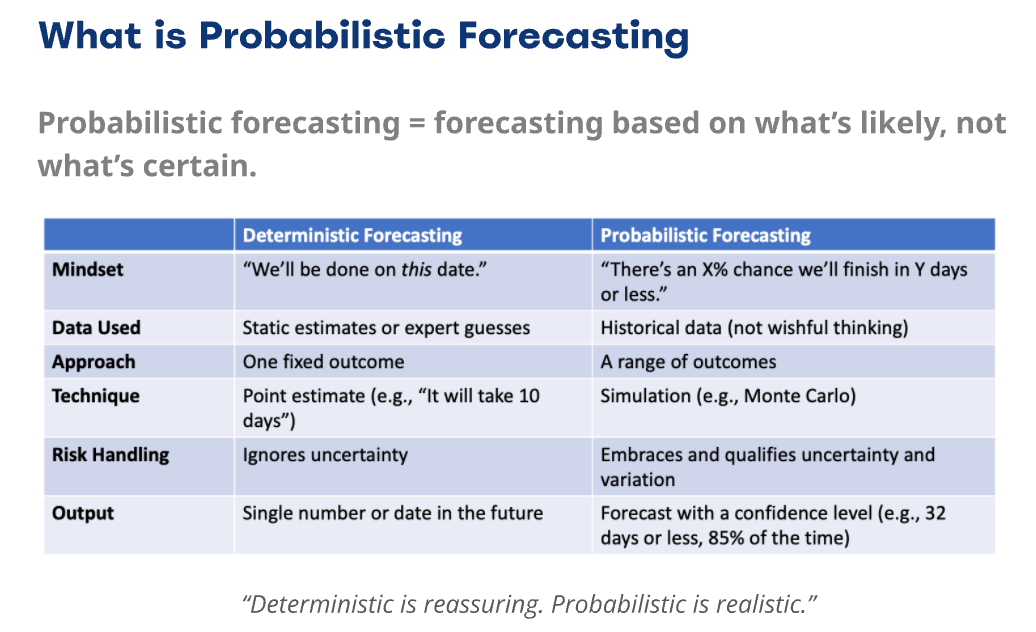
This is what probabilistic forecasting looks like. It’s not about what will happen. It’s about what might happen, and how often. It replaces the seductive precision of “We’ll be done in 10 days” with the more honest, more useful, “There’s an 85% chance we’ll be done in 14 days or less.”
That shift changes everything.
In the workshop, we talked about how deterministic forecasting is built on static estimates, gut feel, and single-point promises. It’s comfortable, but dangerously brittle. It ignores uncertainty. It buries variation. And it sets leaders (and their teams) up to be wrong in the most public way possible.
By contrast, Monte Carlo is grounded in history. It’s adaptive. It’s repeatable. It gives you a range of outcomes and lets you decide how much risk you’re willing to tolerate.
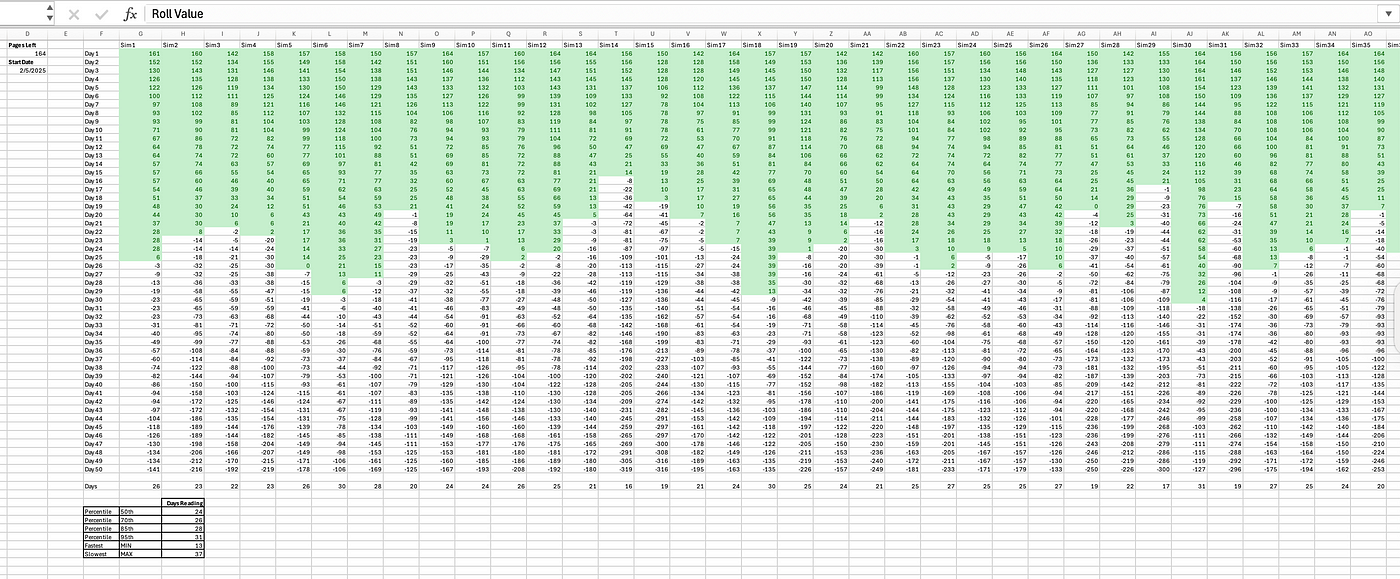
Want to plan with high confidence? Choose the 95th percentile.
Happy to take on more risk and move faster? Maybe plan around the 70th.
It’s your confidence level. Your tradeoff. Your decision.
That’s the magic: not in the simulation, but in the mindset it unlocks.
It turns the conversation from “When will it be done?” to “How sure do we want to be?”
Why It Works
The real power of the dice exercise wasn’t the novelty (though that does no harm!) It was the shift in perspective that it forced.
At the start of the session, leaders reached for the one answer. They wanted the number. A finish date. Something they could take to a steering committee or plug into a Gantt chart. But once they rolled, once they built a handful of finish dates based on actual variability, something shifted.
They stopped arguing about which number was the “right” number.
They weren’t trying to eliminate uncertainty anymore; they were learning to work with it.
They started thinking about what range of numbers was reasonable given the previous history.
That’s when the room got quiet, the good kind of quiet. The kind where mental models are being rewritten in real time.
They began to see that a forecast isn’t a commitment. It’s not a promise. It’s a model, and a way to explore the consequences of our current reality, with a little bit of humility baked in.
Monte Carlo works because it tells the truth in a language leaders can use:
- It reflects how things actually go, not how we wish they’d go.
- It makes uncertainty visible so that we can manage it.
- It reframes planning as a confidence tradeoff, and not a crystal ball.
And most importantly, it builds trust.
Not the fragile trust that comes from delivering “on time” once or twice.
But the resilient kind. The kind that comes from consistently being honest about uncertainty, and still showing up with a plan.
This is why I love using the dice. Because once you’ve felt it and see it, you don’t unsee it.
Why This Changes the Game
Something subtle but important shifted in the room during the exercise, and it wasn’t just the understanding of Monte Carlo. It was the relationship to uncertainty.
Before the simulation, uncertainty was the enemy. It was something to manage, to minimise, to mask with buffers and best-case guesses.
After the simulation, uncertainty became something else: a lever to work with.
The conversation shifted:
- “What’s our level of confidence in this date?”
- “What’s driving the variation?”
- “What’s driving the long tail in our forecasts?”
- “How can we tighten the spread without faking certainty?”
And when leaders get to engage with risk explicitly, rather than pretending it’s not there, everything changes:
- Trust goes up.
- Decision quality improves.
- Delivery becomes less about hitting dates and more about managing likelihoods.
That’s the real power of probabilistic thinking: it rewires how teams talk about planning. It transforms risk from a last-minute fire to a first-class conversation.
Once you’ve rolled the dice and seen ten different paths — all plausible, all data-backed — you don’t go back to “What’s the number?”
You start asking, “What’s our strategy for navigating the range?”
From Book Pages to Backlogs
You might be thinking: “This is a nice story, but I’m not managing a reading list — I’m managing a delivery pipeline.”
Exactly.
The book was never the point. It was just familiar enough, just safe enough, to crack open a new way of thinking. Because if you can model uncertainty with dice and sticky notes, you can absolutely do it with work items and throughput data.
The same principles apply:
- Use historic performance data from your system.
- Simulate it forward, many (many) times.
- View the range, not just the average.
- Make risk visible and manageable by qualifying it.
Because if you can forecast when you will finish your book realistically, you can do the same with your backlog.
The simulation was a trick, sure, but a good one. It upgraded intuition.
It gave leaders permission to let go of false certainty.
It showed that complexity doesn’t have to mean chaos, not if you have a method.
That’s why Monte Carlo forecasting matters.
Not because it’s perfect. But because it’s more honest than pretending there’s only one future.
Not because it guarantees delivery. But because it frames the risk you’re taking, and it lets you choose how much you’re willing to carry.
So yes, I asked a room full of leaders to predict the future with dice.
And they did.
Not because they became data scientists.
But because they stopped asking “When will it be done?”
And started asking, “How sure do we want to be?”
The future isn’t a line. It’s a cloud.
Our job isn’t to banish the cloud — it’s to navigate through it.
Bonus
Want to try the book forecasting simulation for yourself? I’ve built a lightweight Excel workbook that shares the data from a session like this, and mirrors the dice-based Monte Carlo approach.
If you’d like a copy, leave me a comment, and I’ll happily share it with you directly.
About Me
I’m Paul, a Partner at Thrivve Partners and a Product & Flow Practitioner, focused on data-informed, evidence-led ways of working. As a ProKanban trainer, I help teams and organisations navigate complexity, optimise flow, and deliver value, without getting trapped in rigid frameworks. I believe in leading with curiosity, not judgment — helping teams uncover better ways of working through exploration, learning, and continuous improvement.